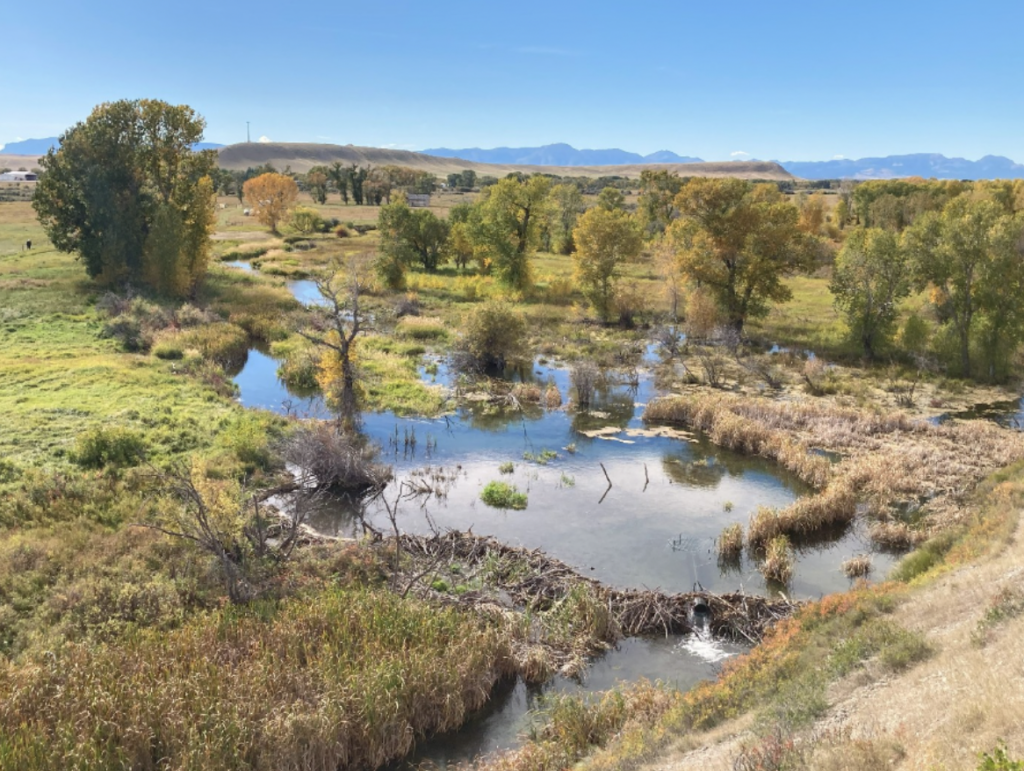
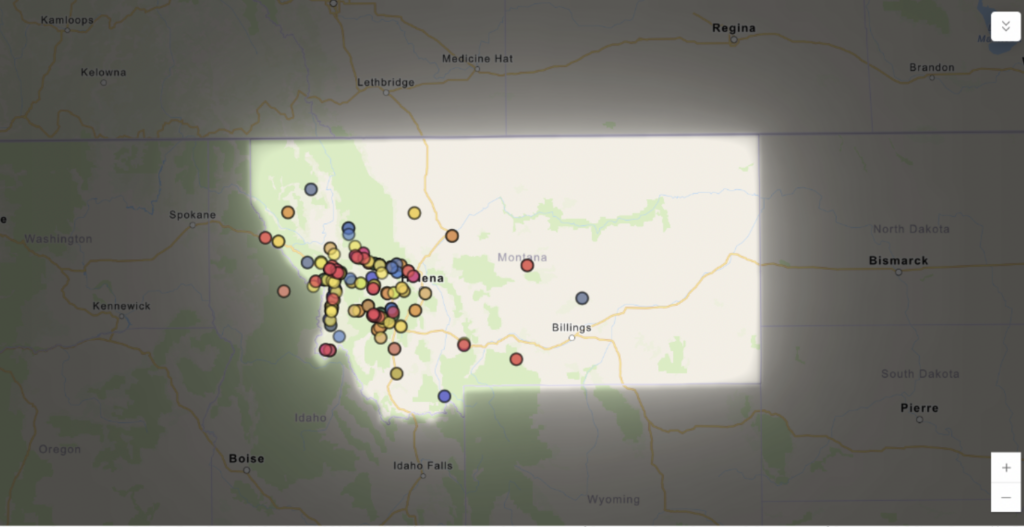
This fall, I found myself immersed in the world of beavers, data points, and digital maps. As a research assistant with Ucross High Plains Stewardship Initiative, I am collaborating with the Montana Beaver Conflict Resolution Program (BCRP) at the National Wildlife Federation to leverage geospatial tools to visualize beaver conflicts and highlight effective mitigation solutions across Montana. The primary goal of this project is to foster coexistence between local landowners and beavers—ecosystem engineers that modify their environment in ways that benefit wetlands, improve water quality and support diverse wildlife. However, they can also become a source of frustration for landowners when their activities lead to flooding or tree damage. Through interactive maps that document conflict areas and showcase successful resolutions, we aim to illustrate where conflicts arise and how both people and beavers can coexist harmoniously across Montana.

Mapping has proven to be an indispensable tool for managing wildlife conflicts. It is not just about marking locations on a map; it’s about making complex relationships visible andaccessible. Previously, BCRP had worked c losely with landowners to address conflicts through practical interventions, like installing flow devices to manage flooding or building tree protection structures. These efforts have significantly reduced friction between beavers and landowners, but the challenge has always been communicating the scale and impact of these efforts. This is where mapping becomes essential. By visualizing conflicts spatially, we can provide insights into where issues are recurring, identify hotspots that need attention, and clearly demonstrate where mitigation strategies have been successful or require further maintenance. This not only helps program staff prioritize resources but also allows landowners to see themselves as part of a broader effort toward coexistence.

To support the coexistence between humans and beavers, my main effort has centered [around creating two interactive maps to represent these dynamics in different ways for different audiences. The internal map is a detailed resource, designed for program staff to analyze intricate specifics of beaver activity and landowner concerns across Montana. It includes layers of data that track individual conflicts, mitigation installations, and ecological outcomes—providing a robust tool for decision-making and strategy development. The external public map, on the other hand, is crafted to engage the broader community. It highlights success stories, shows where coexistence efforts have paid off, and offers a window into how beavers positively shape the landscape. Both maps are intended to serve as tools for education, communication, and ultimately, collaboration between stakeholders. This experience has greatly sharpened my skills in data integration, spatial analysis, and web map development. I feel grateful for the opportunity to apply my GIS and remote sensing skills in such a meaningful project. These tools have not only allowed me to bring clarity to complex issues but also opened up new possibilities for how we approach conservation challenges in the modern world. I look forward to seeing these maps in action, helping foster a future where coexistence is more than an aspiration– it’s a reality, drawn on a map and lived on the ground.
STUDENT RESEARCHER

Xiaofan Shen – Research Assistant | Xiaofan Shen is a Master of Environmental Science candidate at the Yale School of the Environment, specializing in urban heat islands, urban planning, and urban ecology. Before YSE, She earned her bachelor’s degree in Urban Forestry from the University of British Columbia, where she cultivated a deep interest in urban resilience and human-wildlife conflicts. Xiaofan’s research focuses on applying geospatial analysis and remote sensing to tackle environmental challenges in urban areas. She is passionate about using data-driven solutions to create sustainable and inclusive cities. In her free time, Xiaofan enjoys playing musical instruments, swimming, and cooking with friends. See what Xiaofan has been up to. | Blog
