Bald eagle (Haliaeetus leucocephalus) http://photo.accuweather.com/photogallery/2008
April has seen the UHPSI team diving into detailed analysis of avian acoustics. In particular, the team has focused on a sub-sample of recordings from the Big Red acoustic monitoring station during January of 2014. These winter recordings offer remarkably ‘noise’ free recordings, with crisp winter air, frozen waterways, and relatively low wind speeds. Additionally, these recordings highlight the bald eagles (Haliaeetus leucocephalus) that take up their yearly winter residence at the junction of Clear Creek and Piney Creek. While avian diversity is not high at this time of year, we are able to use these clear, simple recordings for building analytical structures that will allow the automatic processing of vast amounts of recorded data in the future.
The first step in the process we’ve developed involves identifying acoustic ‘templates’ – representative vocalizations for our species of interest. Given the amount of variation between and within individuals for any species, identifying a template, or set of templates involves much trial and error, in addition to an artistic touch. To date, we’ve combed through dozens of hours of our recordings in an attempt to isolate those vocalizations that best represent the calls of eagles, ravens, magpies, and jays on the ranch. The figure below shows three of the templates we’ve designed for bald eagles all recorded on January 28th, 2014 at the junction of Clear and Piney Creeks.
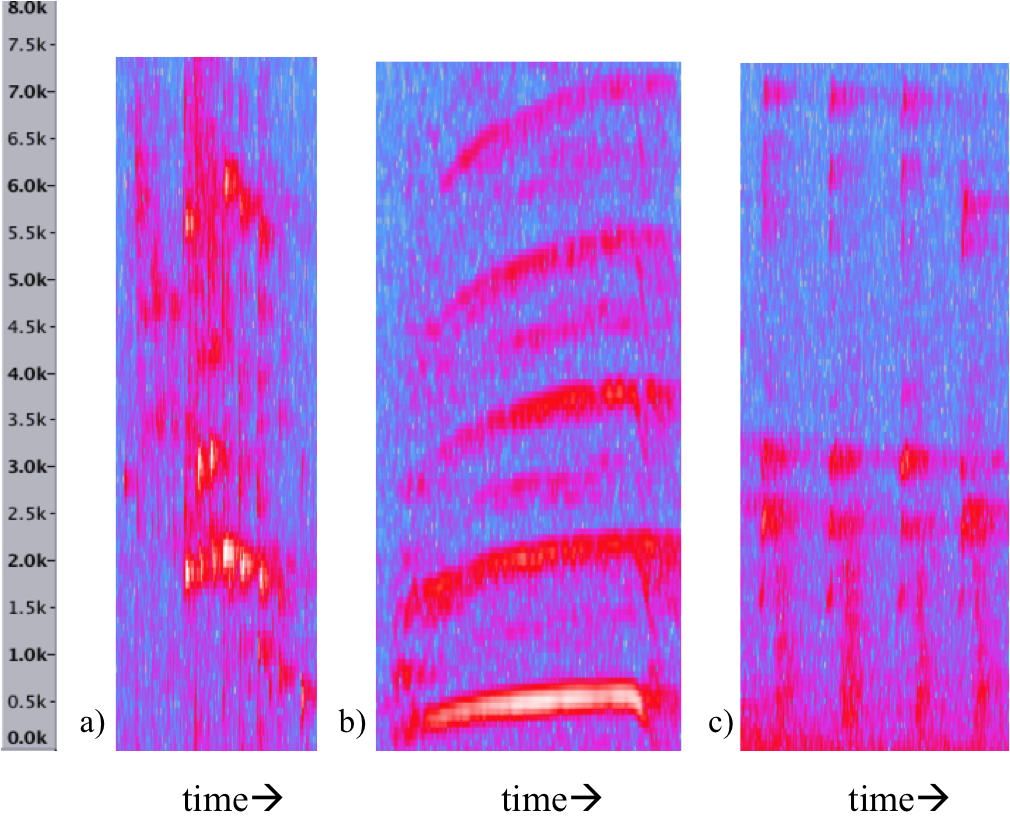
All three images are spectrograms – graphic visualizations of audio signals. The scale on the left shows the frequency of the vocalizations as they progress over time – brighter colors (white and red) indicate louder sounds. The images represent a ‘chatter’ call (a), a ‘screech’ call (b), and a low pitched ‘chatter’ call (c). Combined with a handful of other templates, we can pore through hundreds of hours of recordings to identify all instances of bald eagle calls.
With a handful of vocalization templates in our ‘digital toolbox’, we have begun the process of identifying occurrences of species from the hundreds of hours of recordings we have collected over the last year. While we are currently starting with a small sub-sample of species over a relatively small time from (one month of recordings at two locations represents 180 hours of recording), we are planning on expanding the scope to include a broad suite of birds across the entire coverage of recordings to date. Using free, open source software (package monitoR in the statistical program R), we have written a set of code that allows us to simply press a button, wait a few minutes, and produce graphics showing the occurrence of our species of interest (see below). While these types of analysis are possible with costly software and recording equipment, we’re hoping to demonstrate here at Ucross the power of using free, shareable, open-source analyses and equipment for acoustic data interpretation.
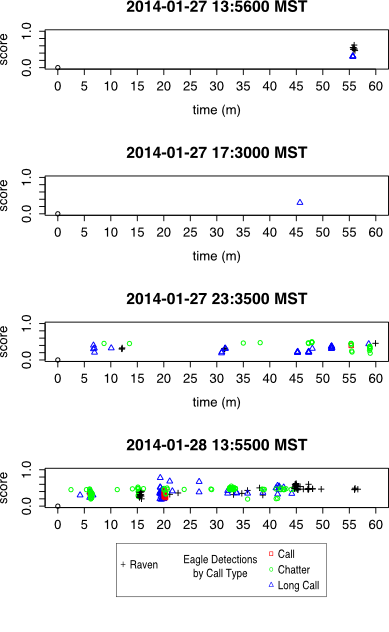
Using the set of vocalization templates shown above, we used our custom code to automatically pore through these four hours of recordings to pull out individual occurrences of bald eagle and raven calls. The titles above each graph to the right indicate date and time (Subtract 8 hours to read Mountain Standard Time). Because of the variation in eagle calls, we used three templates here to capture the range of frequencies the eagles emit. Ravens, with a more uniform call, needed only one template. Note that the evening of the 27th and the morning of the 28th were especially busy times for the bald eagles – perhaps because of a lull in windiness and the warming after a cold snap.
The usage of the package monitoR (used in R) is of particular interest here, because it is still relatively new! It’s first version was released to the general public just this month. With our large database of bird vocalizations, we are currently one of the beta testers of these techniques, which were developed by the Northeast Temperate Network, a collaboration between the University of Vermont, Cornell University, the Vermont Cooperative Fish and Wildlife Research Unit, and the National Parks Service.