The last time I posted, I was a busy forensic ecologist/detective discovering the culprit behind dips in trumpeter swan productivity in western Wyoming. Now, I’m a slick computer programmer using remote sensing data to spatially examine the habitat characteristics selected for by nesting swan pairs. To be transparent, I am neither slick nor a computer programmer, but I’ve had a great time learning how to use Google Earth Engine to learn about wildlife FROM SPACE.
I can’t quite get over how incredibly varied and useful the applications of remote sensing with satellite imagery are. Not only can we observe the earth from space from every angle, almost in real time, but we can use that information to draw conclusions about environmental processes and changes in our planet that we can’t really see from the ground. With the right training and tools, spatial scientists are able to turn a jumble of numbers measuring different forms of reflectance into maps, models, and data used by private companies, NGOs, government groups, and Ucross employees trying to find the best snow for late-season skiing (that’s Charlie by the way).
The launch of Google Earth Engine infinitely expanded access to this sort of information. It made it possible to access and process satellite imagery (and other geospatial data) directly on the Earth Engine server, allowing spatial scientists to perform computationally demanding tasks basically anywhere with an internet connection. Users are also able to share images, scripts, and assets easily within the Google servers, allowing for collaborators from across the globe to work more effectively together. For the environmental field, this is BIG. It’s basically twitter for geospatial scientists.
Over the past few months, myself and the Ucross team have used Earth Engine to create a classification of wetland habitat in Wyoming using Sentinel 2 imagery. We processed the spatial layers used to create data for a resource selection model identifying characteristics of swan nest sites in Wyoming. This model will then be applied over the entirety of Wyoming to create a habitat suitability map for nesting swan pairs statewide. What is especially exciting about this is that we were able to use Sentinel 2 imagery with 10 meter resolution, which provides much better detail than LANDSAT’s 30 meter resolution. Because swans select nests on such a fine scale, using Sentinel 2 imagery will allow for more accurate habitat mapping. Characteristics that would easily be missed with LANDSAT are picked up by Sentinel 2.
Unfortunately, my time at Ucross has come to an end, and I will be starting a new job next week. The swan project lives on, and will continue as part of a collaboration between Wyoming Game and Fish. Ucross, and the Nature Conservancy. LONG LIVE THE SWANS. [Mic drop]
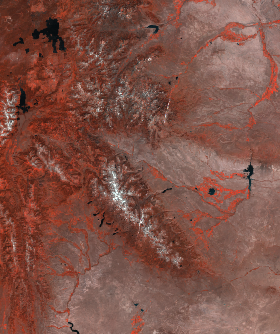
Sentinel 2 Imagery, false color composite, NW Wyoming. The bright red tendrils are rivers and their surrounding wetlands