Catherine and Charlie ventured into the field last week with our portable spectrometer, courtesy of the Yale Center for Earth Observation. Our goal in these first few trips with the spectrometer was to capture spectral ‘signatures’ of leafy spurge – in other words, the unique ways in which spurge reflects light (both visible light and light invisible to the human eye). With these signatures in hand, we then headed back to our satellite imagery captured last summer, and asked our models to search the images for everything that resembles our ground-truthed leafy spurge reflectance values.
In addition to collecting signatures of leafy spurge in the field, we also needed to look at signatures in a controlled lab environment without the influences of solar radiation and refraction. Below you can see the spectrometer set up in the Raymond Plank Center, with samples of leafy spurge set on a pure black test board under high intensity full spectrum lights. While we had the lights on to take this picture, when collecting signatures in the lab, it is important to run the spectrometer in a dark room – free of external light pollution.
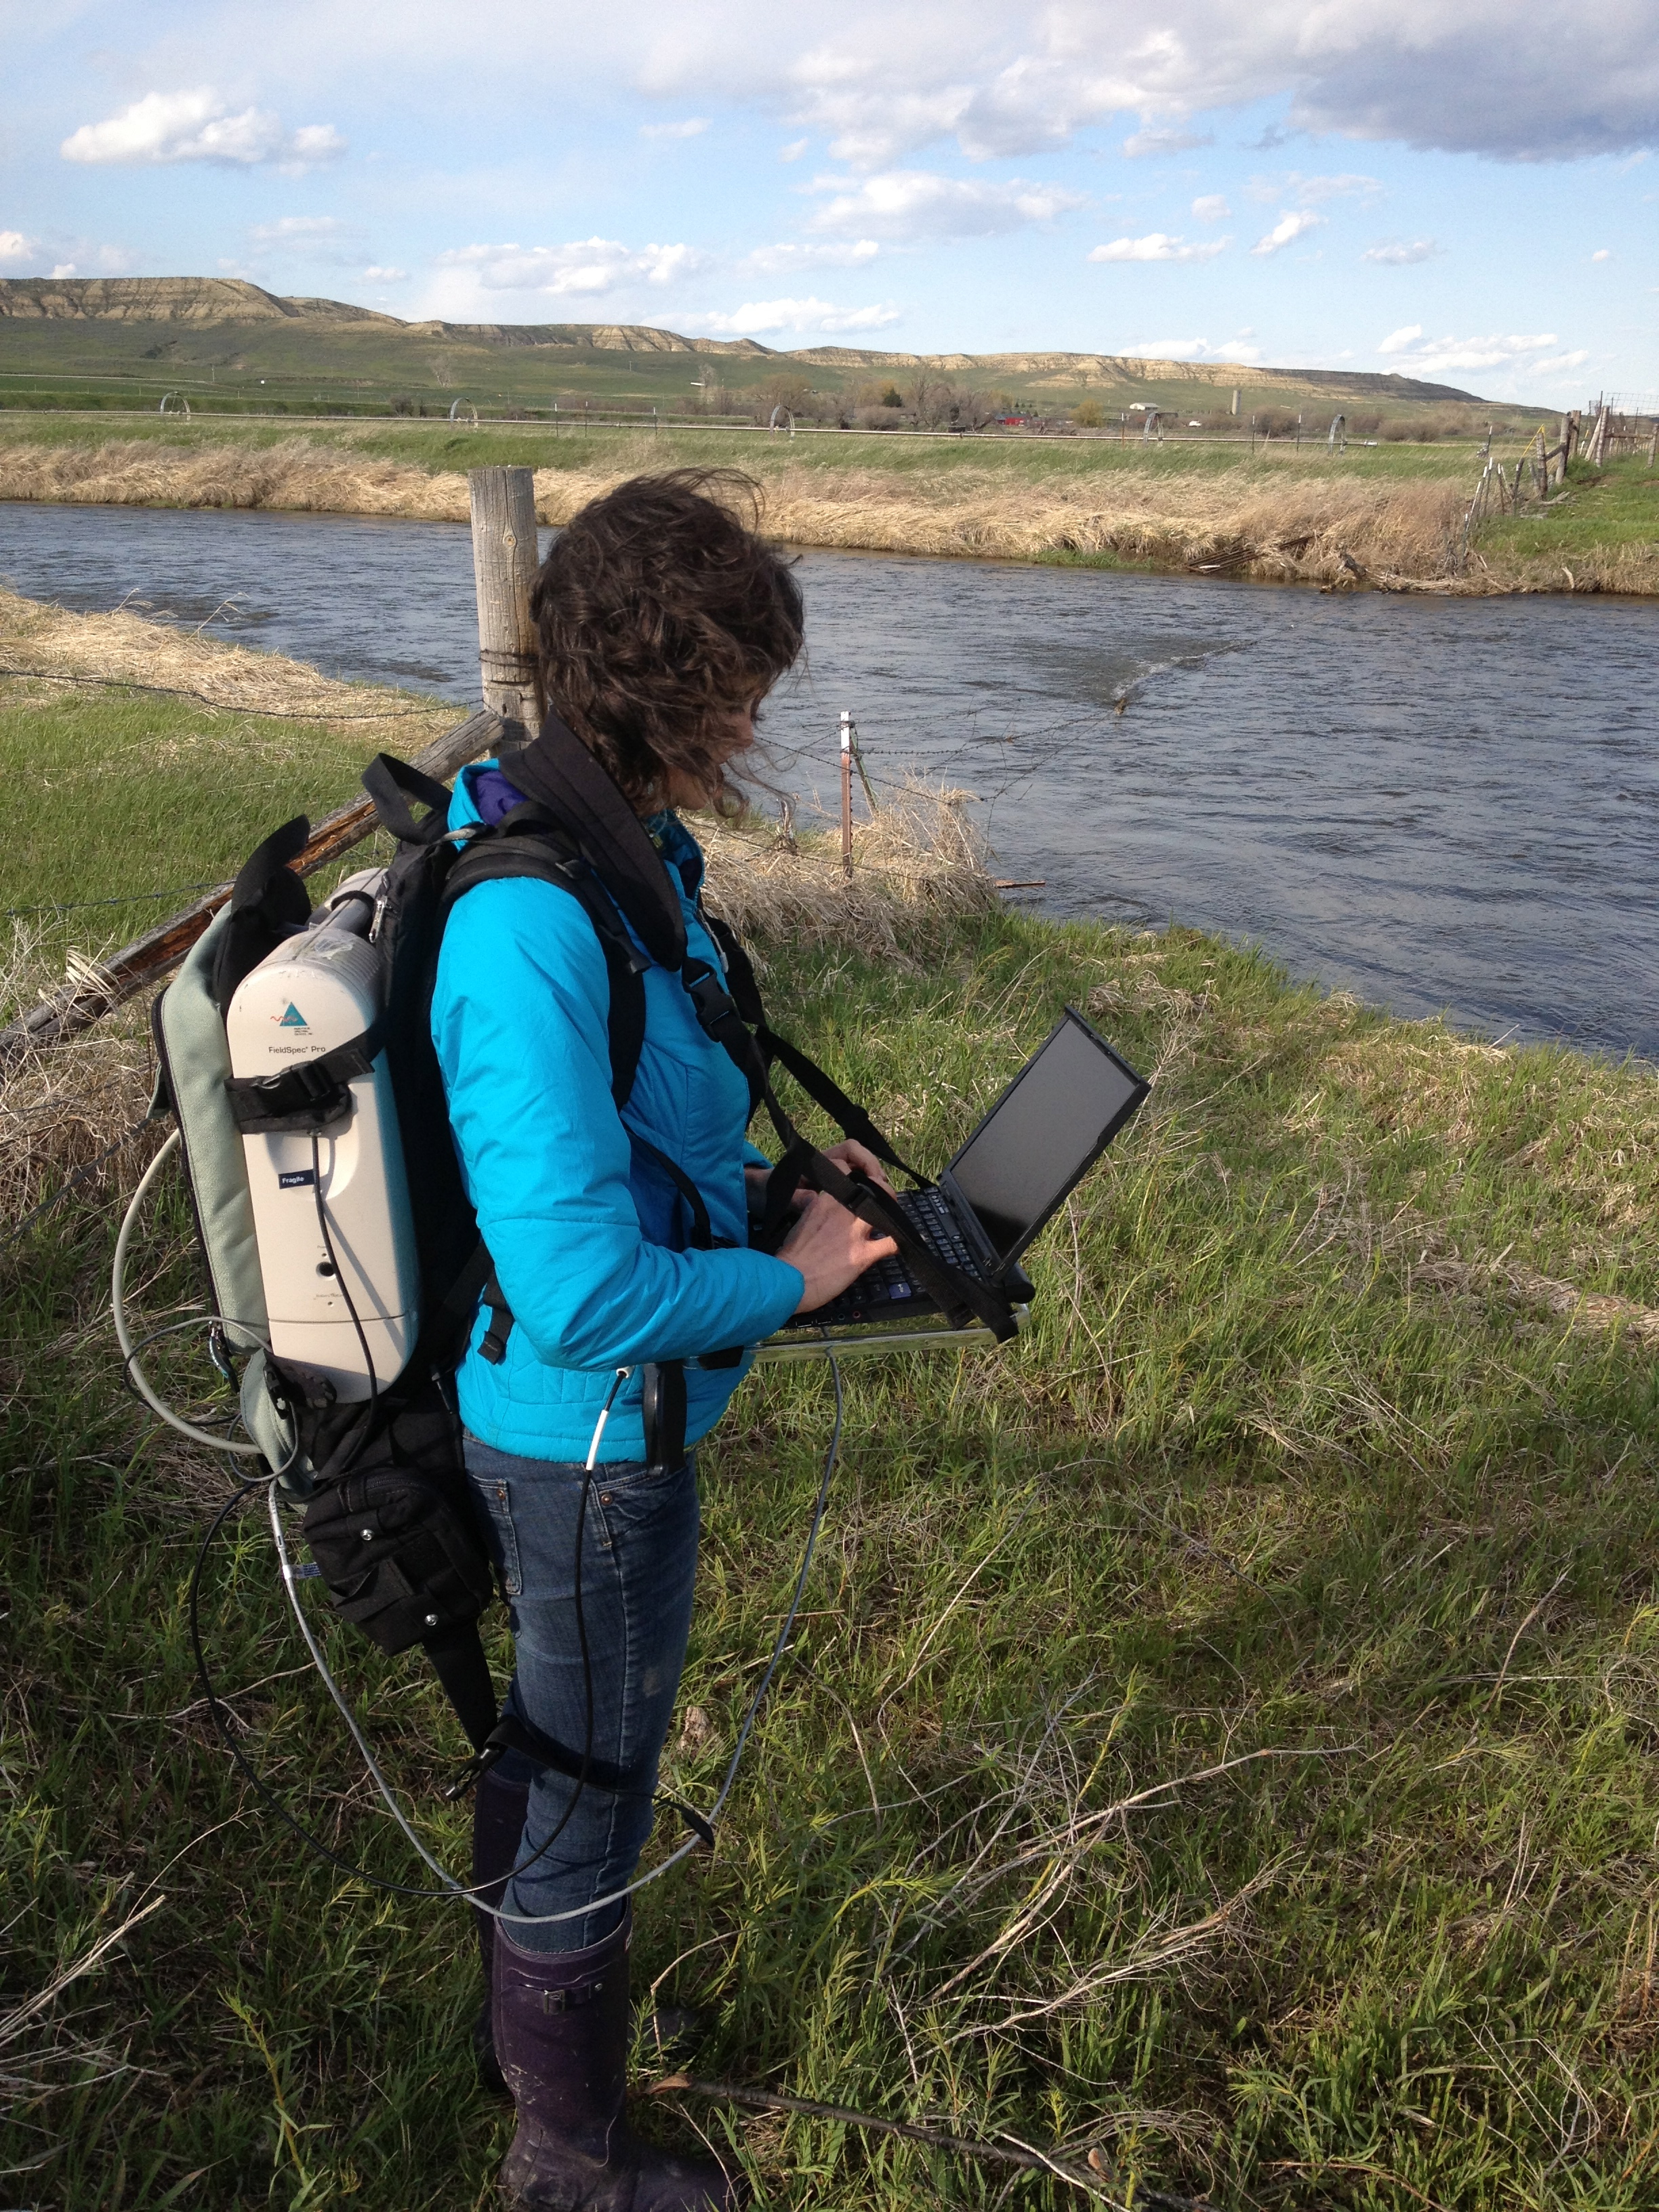
 In the photo below, you can see Catherine along Clear Creek in the Bauman Wetlands. Because of the late, cold, snowy winter, vegetation (and spurge in particular) has had a slow start this spring. It’s been slightly tricky to find dense patches of spurge that have emerged above the early season grasses. You can tell from the picture that it’s still pretty cold and windy on the ranch!
While searching for patches of spurge (which we eventually tracked down), we were impressed by the results of Nathan Lindsey’s (the ranch conservation manager) work on controlling spurge with multi-species grazing and targeting herbicide spraying. We noticed many places with desiccated spurge from 2013 with little to no regrowth!
The image directly below shows the results of our field spectrometry. On the x-axis is wavelength in nano-meters – visible light falls roughly between 400 and 700 nm, with near-infrared and infrared between 700 and 10,000 nm (see bottom-most image). on the y-axis is DN, a measure of reflectance. Note the spikes in reflectance in the green wavelengths (~ 550 nm), and the major spike in the near infrared (~ 750 nm). These signatures will take some refining to get exactly right, but hopefully we’re on the path to success!
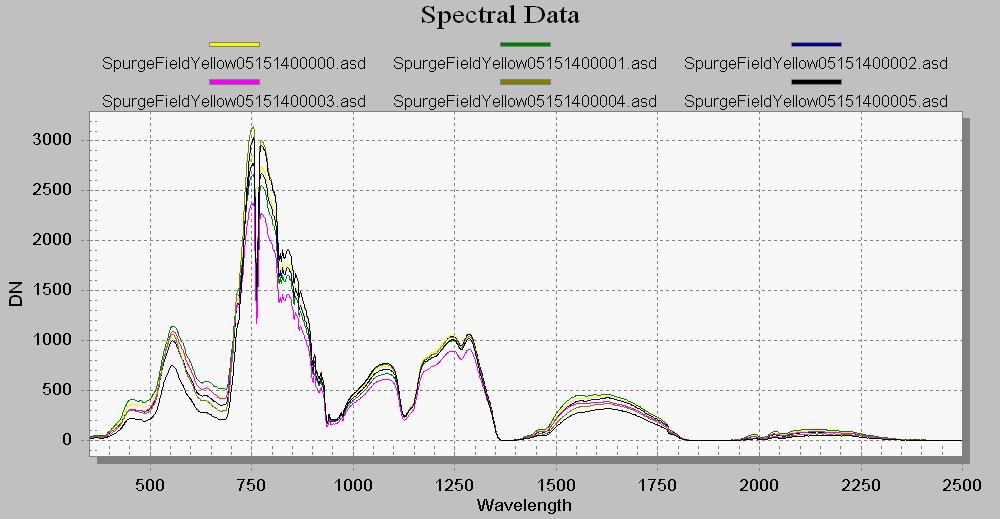
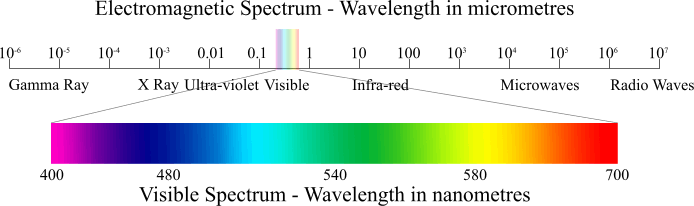
image courtesy of: www.sat.dundee.ac.uk/spectrum.html