Being a research assistant with the Ucross High Plains Stewardship Initiative at YSE has afforded me a variety of opportunities to expand my knowledge in the field of mesic restoration in the western United States. Focusing on a region that is highly susceptible to drought events creates an interesting challenge when tracking water availability. The American West is becoming increasingly vulnerable as extreme weather events become more frequent and more severe. The scope of this work is to create a protocol in order to evaluate the impacts of beaver dam analogs on riparian areas in central Montana. Beaver dam analogs are man-made structures that are built to mimic the ecological impacts of a real beaver dam. Myself and my co-worker, Sam Wilson, have been utilizing GIS and remote sensing technologies to understand how these analogs impact herbaceous productivity. Our hypothesis is that by mimicking beaver dams, water will become more available to the surrounding vegetation. By installing systems that prevent runoff, the ecosystem will build drought resistance, thus increasing its overall function as well as forage availability for the livestock of local ranchers.
While our team will ultimately analyze multiple metrics over multiple years, we chose to first focus on the Normalized Difference Vegetation Index (NDVI). NDVI is a powerful tool that utilizes satellite imagery to detect if an area of interest contains live, green vegetation. This is a strong metric to observe as it allows us to understand the greenness surrounding the beaver dam analog, thus indicating increased vegetation growth due to more water availability. I am currently utilizing GIS softwares to visualize how greeness (i.e., vegetation) has changed over a temporal scale. In order to monitor an area effectively, a baseline must be created, allowing for comparisons to be made over time. I have chosen to go back 10 years to 2012 to begin the temporal analysis. The BDA’s were installed in 2022, therefore once satellite data has been released for the year of 2023, our team will be able to analyze the NDVI in our interest area to track how greenness has changed over time. We will then calculate exactly how green our area appears to be for each year, allowing us to directly compare vegetation rates from our baseline to any new data that becomes available. One main goal of this protocol is that it can be easily uptaken by a next user. Therefore, the specific knowledge of geocoding will not be necessary to analyze and compare the GIS data.
Partnering with The Nature Conservancy-Montana (TNC), Montana Conservation Corps (MCC), and World Wildlife Fund (WWF) has been an incredible experience as all of the team members have a strong passion and dedication towards restoring water availability in the western United States. I look forward to our shared collaboration and hope to utilize my skills to increase agricultural productivity and food security across the states.
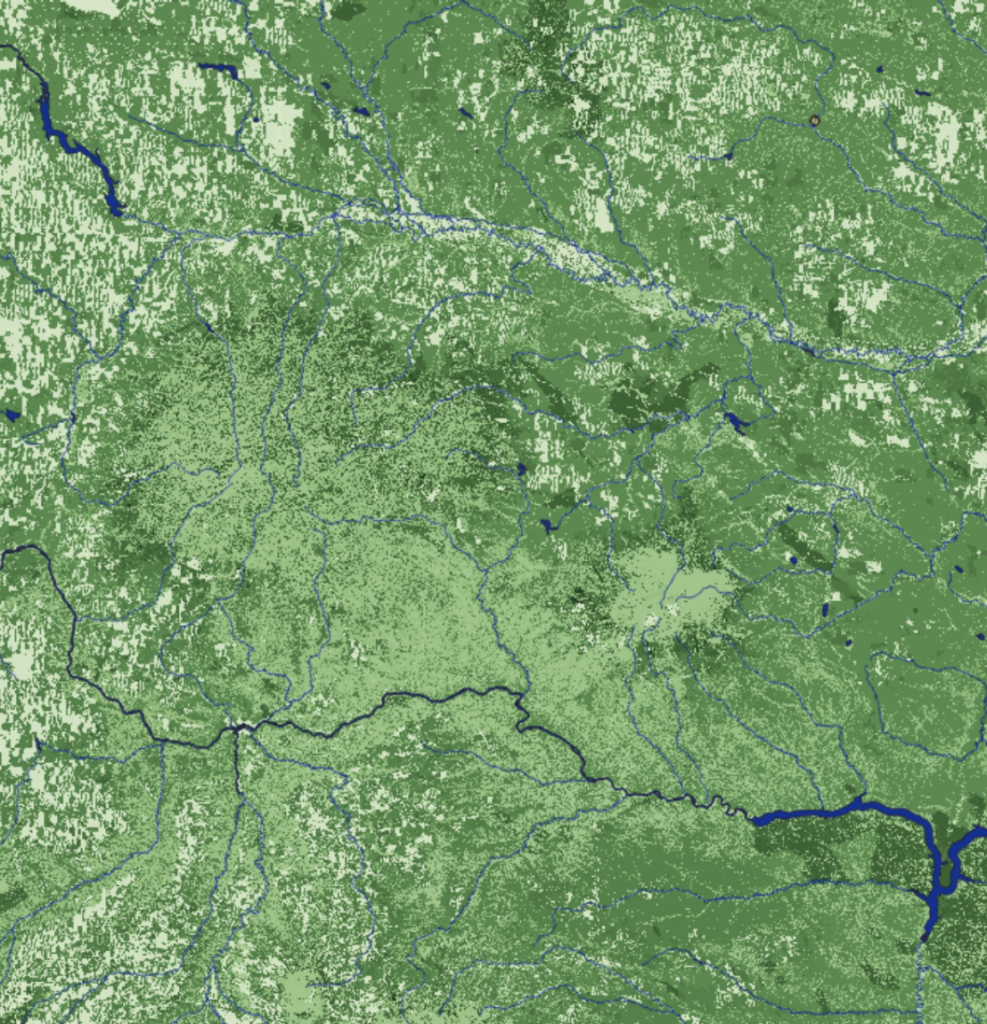
Normalized Difference Vegetation Index (NDVI) in central Montana reveals which areas have a high percentage of vegetation (dark green), and which areas have little vegetation (light green).